Charlotte Real Estate: July 2023
Charlotte real estate in July 2023 saw home sales decline 20.7% year-over-year to their lowest level in 10 years. Home prices increased 4%, on average. July saw the first increase in year-over-year median price since January 2023. Higher home prices, increasing interest rates, fewer new listings and less inventory are clearly impacting sales. Homes sold in 29 days. New listings declined 30.2% putting pressure on inventory, which decreased 30% year-over-year. The months supply of homes remained low at 1.4 months, decreasing for the first time in one year and keeping Charlotte in “home seller territory.” Home affordability continues to suffer.
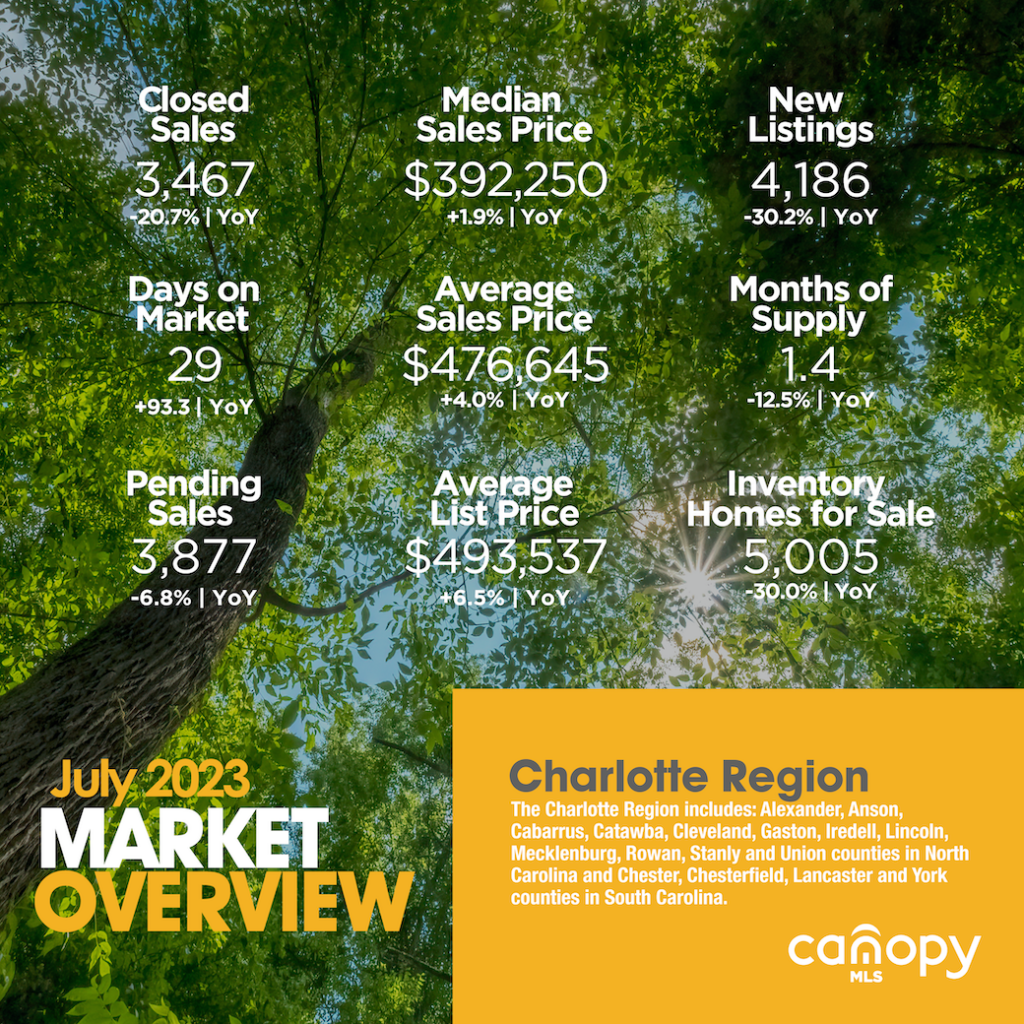
Charlotte Real Estate Activity: July 2023
Charlotte real estate market in July 2023: Latest news on the Charlotte Region and what it means for you…

July 2023 home sales declined in the 16-County Charlotte Region year-over-year, as did pending sales. Sales are happening, but not at the volumes experienced in 2021 and the first half of 2022. Buyer demand weakened in July, falling 6.8% compared with one year ago. Home buyers remained frustrated by fluctuating rates, lack of new inventory, rising home prices, and economic uncertainty.
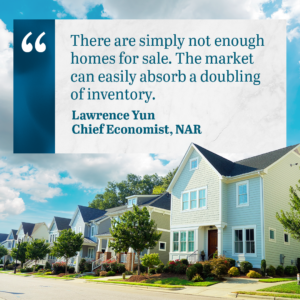
Seller activity also continued to fall, with listing activity down 30.2% year-over-year. This impacted inventory for a second consecutive month, causing the months supply of inventory to decline in July for the first time in a year.
Without consistent new listing activity, housing inventory will remain tight, putting upward pressure on home prices. Closings in July 2023 fell back to the level of units sold in July 2013, which was the year Charlotte’s housing market began recovering from the Great Recession. This was the first time in 10 years that closed sale units dropped to this level.
Closed sales declined 20.7% (by 904 homes) year-over-year in July. Compared with June 2023, closed sales declined by 694 homes. Pending sales also declined 6.8% year-over-year. Month-over-month pending sales declined by 178 properties.
The real cost to buy a house has spiked over 55% since 2022, as the Federal Reserve raised rates seven times in 2022 and already five times in 2023. Mortgage rates topped 6% for the first time since 2008 and went over 7%. The Charlotte region housing affordability index continues to drop and impact sales volume. Housing affordability dropped 13.2% year-over-year in July 2023.
Year-over-year average list and sale prices increased modestly in July 2023 and year-to-date. Home prices continue to increase, but at a slower pace. Median sale price increased 1.9% year-over-year and is down 0.5% year-to-date versus July 2022. This was the first year-over-year increase in median sale price since January 2023. Month-over-month, median home price is up 0.8%. (The median sale price is the best measure of price over time, as it factors out extreme highs and lows in home prices.)
 Inventory declined 30% in July compared to the same time last year. In July 2023 there were 2,147 fewer properties for sale than one year ago. Month-over-month, the number of properties for sale also decreased.
The months supply of housing decreased 12.5% from 1.6 months to 1.4 months year-over-year. Month-over-month, the months supply of inventory was flat. The 1.4 months supply of homes keeps Charlotte region in “seller territory.” However, sellers don’t have the same strong position they had in previous years. Pricing key to attracting buyers and selling quickly. Although Charlotte Region is still technically a seller’s market, the days of receiving significant amounts over asking price are behind us and sellers need to reset their expectations.
New listing activity decreased 30.2% in July 2023 compared with July 2022, with 1,815 fewer properties listed. Month-over-month, Charlotte region saw 469 fewer listings come on market. With new listing activity declining month after month, it’s no wonder that inventory is trending down.
Averaging 29 days on market, the days on market increased 93.3% by 14 days year-over-year. Days on market were flat compared with the previous month of June. Pricing a home correctly remains critical for sellers, as the “right” price brings buyers and results in fewer days on market.
With a list to sale price ratio of 98.3% in July 2023 (down 2% year-over-year, but flat month-over-month), buyers are carefully scrutinizing listing prices and sellers are not in as strong of a position as they were during the pandemic years.
Moving forward into the remainder of the summer selling season and into fall, both sellers and buyers continue to be distracted by growing economic concerns, higher interest rates, and negative housing headlines. The slowdown in home sales that began when mortgage rates increased in 2022 is expected to continue in the coming months. The costs to purchase a home will remain high, challenging affordability at a time when overall budgets continue to be squeezed by inflation. Buying power will remain on the decline with typical mortgage payments 28+% higher on average, pricing many first-time and workforce buyers out of the market.
Charlotte Region Real Estate Snapshot: July 2023
- Closed Sales: down 20.7% year-over-year; down 20.1% year-to-date.
- Homes Sold: 3,467 in July 2023 versus 4,371 in July 2022.
- Pending Sales: down 6.8% year-over-year; down 12.7% year-to-date.
- New Listings: down 30.2% year-over-year; down 22.4% year-to-date.
- Inventory of Homes: down 30% year-over-year to 5,005 compared with 7,152 in July 2022.
- Months Supply of Homes: down 12.5% with 1.4 months supply of homes compared with 1.6 months in July 2022.
- Days on Market Until Sale: 29 days in July 2023 versus 15 days in July 2022. Year-to-date, days on market are up 21 days year-over-year to 39 days.
- Average Sale Price: up 4% year-over-year to $476,645. Year-to-date home prices were up 3.8% year-over-year to $458,980.
- Median Sale Price: up 1.9% year-over-year to $392,250. Year-to-date, median sale price was down 0.5% at $376,269.
- % of Original List Price Received: 98.3%, decreasing 2% year-over-year; year-to-date, the list to sale price ratio was 97.1%, down 4.4%.
- Housing Affordability Index: down 13.2% year-over-year to 79 from 91; year-to-date, the affordability index was down 11.8% to 82 from 93.
Want to know what this would mean for your family if you decide to buy or sell a Charlotte region home?

We can help.
Call us today at 704-779-0813 or contact us here.
There’s absolutely NO OBLIGATION. A consultation with Carolinas Realty Partners is FREE.
MEDIAN HOME SALE PRICE TRENDS IN THE CHARLOTTE REGION
LOOKING FOR YOUR DREAM HOME IN THE CHARLOTTE AREA?

FREE Home Buyer Guide: “Things To Consider When Buying A Home”
WONDERING WHAT YOUR CHARLOTTE AREA HOME IS WORTH IN TODAY’S MARKET?

PRICING YOUR HOUSE RIGHT IS CRITICAL: VIDEO
FREE Home Seller Guide: “Things To Consider When Selling Your House”
THINKING OF SELLING YOUR HOME? CHECK OUT THE COLDWELL BANKER MARKETING ADVANTAGE
SEARCH ALL CHARLOTTE AREA HOMES FOR SALE

This Charlotte region housing market update is provided by Nina Hollander with Coldwell Banker Realty, Greater Charlotte area residential real estate experts serving Charlotte region home buyers and sellers for 24+ years.
If you’re considering selling or purchasing a home in the Charlotte region, I’d love an opportunity to earn your business, to exceed your expectations, and to show you why experience matters and how:
“The Right Broker Makes All The Difference.”
Find Your Charlotte Region Dream Home
Thinking about buying or selling a home in the Charlotte area?
Nina Hollander is an expert local real estate agent serving Charlotte and surrounding communities. Whether you’re just starting your search or ready to make a move, Nina is here to provide trusted guidance every step of the way. Contact Nina today to get personalized help with your real estate goals.
Thinking about selling your Charlotte home? Request our free Charlotte home value report and to see what your home may be worth in today’s real estate market.
Check out the Real Estate Market in Charlotte NC
I work hard for my clients to ensure they have the best selling or buying experience possible. For comprehensive real estate information in the Greater Charlotte NC area, check out the links below!