
Charlotte Real Estate Report July 2026
Latest news on Charlotte real estate July 2026 and what it means for you…
The Charlotte Region housing market in July 2026 continued its gradual transition toward greater balance. Inventory expanded and sales activity remained steady despite mortgage rates moving into the upper-6% range. Pending sales increased 2.1% year-over-year. Closed sales rose 1.6%, and inventory climbed 6.9%, giving buyers more choices and greater negotiating room than they had a year ago.
Home prices also continued to hold relatively firm. The median sales price increased 1.1% to $410,000. The average sales price rose 7.0% to $545,079. At the same time, homes took longer to sell, averaging 55 days on market compared with 46 days last July. The slower pace reflects buyers having more time to compare their options as inventory grows and affordability remains a concern.
Overall, the Greater Charlotte housing market remained stable. Inventory is grew and buyers are became more deliberate and selective, but demand did not disappeared. Sales remained slightly ahead of last year and home values continued to hold, creating a market that is gradually becoming more balanced for buyers and sellers alike.
Market Activity and Demand
Pending sales reached 3,963, up 2.1% year-over-year. While contract activity remained ahead of last July (up 2.1% year-over-year), pending sales declined 5.7% from June as buyers navigated mortgage rates in the upper-6% range and continued affordability pressures.
Closed sales totaled 4,142, up 1.6% year-over-year. Closed sales declined 4.7% from June, but the year-over-year increase demonstrates that buyers continue to move forward with purchases even as borrowing costs remain elevated and inventory expands.
List-to-Sales Price Ratio: Sellers received 96.0% of original list price, essentially unchanged from both one month and one year ago. Even with more inventory and longer marketing times, appropriately priced homes continue to support seller values.
KEY TAKEAWAY: Buyer demand remains steady, although buyers are moving more deliberately. Pending and closed sales both remained above last year’s levels despite higher borrowing costs, while growing inventory is giving buyers more choices and negotiating room.
Pricing Trends
Median sales price increased to $410,000, up 1.1% year-over-year. Despite expanding inventory and a slower market pace, median prices continued to appreciate modestly.
Average sales price reached $545,079, up 7.0% year-over-year. The increase indicates continued support for home values even as buyers have more properties from which to choose.
Average list price increased to $546,191, up 8.3% year-over-year. With inventory rising and homes taking longer to sell, however, accurate pricing has become increasingly important for sellers.
KEY TAKEAWAY: Home prices remain relatively stable rather than accelerating rapidly. Growing inventory is giving buyers greater negotiating leverage, while appropriately priced homes continue to support seller values.
New Listings
New listings totaled 5,532, up 1.1% year-over-year. New listings declined 2.7% from June, while overall available inventory increased 6.9% from one year ago to 13,600 homes.
The continued growth in available inventory is providing buyers with a broader selection of homes and increasing competition among sellers.
KEY TAKEAWAY: Buyers have considerably more choice than they did during the inventory-constrained markets of recent years. For sellers, that makes competitive pricing, condition, presentation and effective marketing increasingly important.
Inventory and Market Balance
Months supply of inventory increased to 3.7 months, up 5.7% year-over-year. Total inventory reached 13,600 homes, up 6.9% from last July.
Although inventory continues to expand across the Charlotte region, supply remains below the level generally associated with a balanced market. Buyers have more choices and greater negotiating room than they did a year ago, while steady demand continues to support sellers.
KEY TAKEAWAY: The Charlotte housing market continues its gradual move toward greater balance. More inventory is creating additional opportunities for buyers without producing a significant decline in home values.
Average Days On Market
Homes spent an average of 55 days on market, up 19.6% year-over-year, compared with 46 days last July and compared with 47 days one month ago.
Longer marketing times reflect a slower, more measured market as increased inventory gives buyers more time to compare properties before making an offer.
KEY TAKEAWAY: Homes are taking longer to sell, making accurate pricing increasingly important. Buyers have more time and leverage, while sellers need to position their homes competitively from the beginning rather than relying on the urgency created by limited inventory.
Showing Activity
Showing activity across the Charlotte region declined 1.0% year-over-year and 4.3% from June. Listings averaged 3.8 showings per property.
Top markets for buyer showing activity included:
- Matthews: 5.2 showings per listing
- Waxhaw: 4.8 showings per listing
- Kannapolis: 4.5 showings per listing
- Union County: 4.5 showings per listing
KEY TAKEAWAY: Buyers remain engaged, but they are becoming more selective and deliberate. Affordability, location and value are playing increasingly important roles in determining which homes and communities attract the strongest activity.
What This Means For Charlotte Region Home Buyers & Sellers
The Charlotte Region housing market remained remarkably stable in July even as inventory continued to expand and mortgage rates moved into the upper-6% range. Pending and closed sales remained slightly ahead of last year, while buyers gained more choices, more negotiating room and more time to make purchasing decisions.
For home buyers: Rising inventory is creating more opportunities and greater negotiating flexibility. With 13,600 homes available across the region and a 3.7-month supply, buyers have more choices than they did a year ago. Higher borrowing costs remain an important affordability consideration, however, making it especially important to evaluate the total cost of homeownership rather than focusing solely on purchase price.
For home sellers: Buyers are still purchasing homes, but they are moving more deliberately and have more alternatives. Homes averaged 55 days on market in July, reinforcing the importance of accurate pricing, strong presentation and effective marketing from the moment a property enters the market.
The July numbers point to a Charlotte housing market that is becoming more balanced—not because buyer demand has disappeared, but because greater supply and a slower pace are creating a more even playing field for buyers and sellers.
CHARLOTTE REGION JULY 2026 REAL ESTATE SNAPSHOT
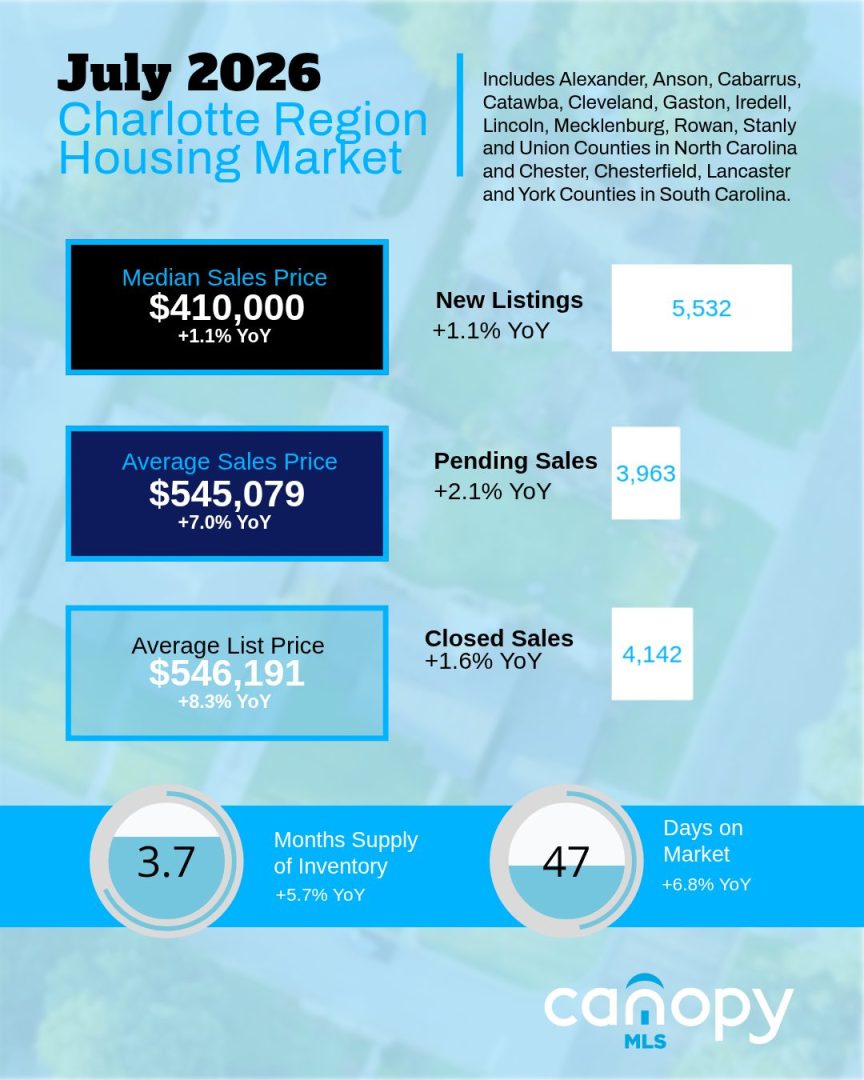
Based on information from Canopy MLS for the period July 1, 2026-July 31, 2026 in the 16 County Charlotte Region.
Want to know what this would mean for your family if you decide to buy or sell a Charlotte region home?
I can help.
Call me today at 704-779-0813 or contact me here.
There’s absolutely NO OBLIGATION. A consultation with Nina Hollander is FREE.
LOOKING FOR YOUR DREAM HOME IN GREATER CHARLOTTE?

FREE Home Buyer Guide: “Things To Consider When Buying A Home”


Thinking about buying or selling a home in the Charlotte area?
Nina Hollander is an expert local real estate agent serving Charlotte and surrounding communities. Whether you’re just starting your search or ready to make a move, Nina is here to provide trusted guidance every step of the way. Contact Nina today to get personalized help with your real estate goals.
Thinking about selling your Charlotte home? Request our free Charlotte home value report and to see what your home may be worth in today’s real estate market.
Check out the Real Estate Market in Charlotte NC
I work hard for my clients to ensure they have the best selling or buying experience possible. For comprehensive real estate information in the Greater Charlotte NC area, check out the links below!