Charlotte Real Estate Report October 2025

Latest news on Charlotte real estate October 2025 and what it means for you…
The Charlotte housing market in October 2025 remained steady. The Charlotte region showed a mix of rising activity and growing inventory, signaling a market that is moving toward a healthier balance between buyers and sellers. Buyer activity remained steady in October, with closed sales across the 16-county Charlotte region nearly matching last year’s levels. The region, which includes key counties across North and South Carolina, continues to demonstrate steady demand but with signs of moderation compared to the high growth of prior years.
Market Activity and Demand
New listings reached 4,895, a 7.6% year-over-year increase. New listings rose 4.4% from the previous month of September.
Key takeaway: Sellers returned to the market, encouraged by strong prices and easing mortgage rates. The rise in listings expands options for buyers who have faced limited inventory over the past two years.
Pending sales totaled 3,721, up 6.8% from last year and were flat month-over-month.
Key takeaway: Buyer activity remained strong, suggesting renewed confidence and continued population and job growth driving housing demand in the Charlotte metro area combined with softening interest rates.
Closed sales came in at 3,574, marking a 0.7% year-over-year increase.
Key takeaway: The follow-through on pending contracts underscored solid market fundamentals and steady transaction flow.
Pricing Trends
The median sales price rose slightly to $400,000, a 1.8% increase year-over-year. Month-over-month, the median sale price rose slightly from $397,000.
Key takeaway: Price growth has stabilized after several years of double-digit gains, suggesting that the market is finding equilibrium as inventory expands.
The average sales price reached $511,464, up 4.7% year over year. Month-over-month, the average sale price increased from $505,510.
Key takeaway: While inventory rose last month, prices remained relatively stable. Although prices continued to edge upward, the slower pace is helping improve affordability for buyers compared with the highly competitive years immediately following the pandemic.
The average list price climbed to 538,418, an 8% increase year-over-year.
Key takeaway: Sellers are testing higher price points, but the smaller rise in actual sales prices indicates that buyers remain price-conscious.
Inventory and Market Balance
The number of homes for sale rose sharply to 12,090, up 24.6% year-over-year. By the same token, month-over-month the number of homes for sale increased by just eight properties.
Key takeaway: More available homes ease pressure on prices and offer buyers a wider selection. The steady rise in inventory indicates a gradual shift toward more balanced market conditions, aligning supply more closely with ongoing buyer demand.
Months supply of inventory increased to 3.3 months, a 17.9% year-over-year increase. Month-over-month, there was no change in the months supply of inventory.
Key takeaway: Although still below the four to six months typically associated with a balanced market, the increase in months supply shows demand has remained softer throughout the year, allowing inventory to build and the market to gradually loosen.
Market Pace
Homes spent an average of 54 days on the market, a 28.6% increase year-over-year. Compared with one month ago, days on market increased by just one day from 53 days.
Key takeaway: Properties are staying on the market longer, reflecting a slower pace of decision-making by buyers.
Overall Market Performance: October 2025
New listings 4,895, up 7.6% Year over Year (YoY)
Pending Sales 3,721, up 6.8% YoY
Closed Sales 3,574, up 0.7% YoY
Median Sales Price $400,000, up 1.8% YoY
Average Sales Price $511,464, up 4.7% YoY
Average List Price $538,418, up 8.0% YoY
Days on Market 54, up 28.6% YoY
Inventory of Homes for Sale 12,090, up 24.6% YoY
Months Supply of Inventory 3.3, up 17.9% YoY
List to Sale Priced Ratio 95%, down 0.9% YoY
Bottom Line
The Charlotte region’s housing market in October 2025 continued to reflect a soft landing—steady sales activity combined with rising inventory and modest price growth. For buyers, greater inventory and slower price growth offer more opportunities and negotiating power. For sellers, pricing strategically is increasingly important, as buyers have become more selective. Overall, the Charlotte region is showing signs of normalization, moving away from the overheated conditions of past years toward a more sustainable and stable housing environment.
CHARLOTTE REGION OCTOBER 2025 REAL ESTATE SNAPSHOT
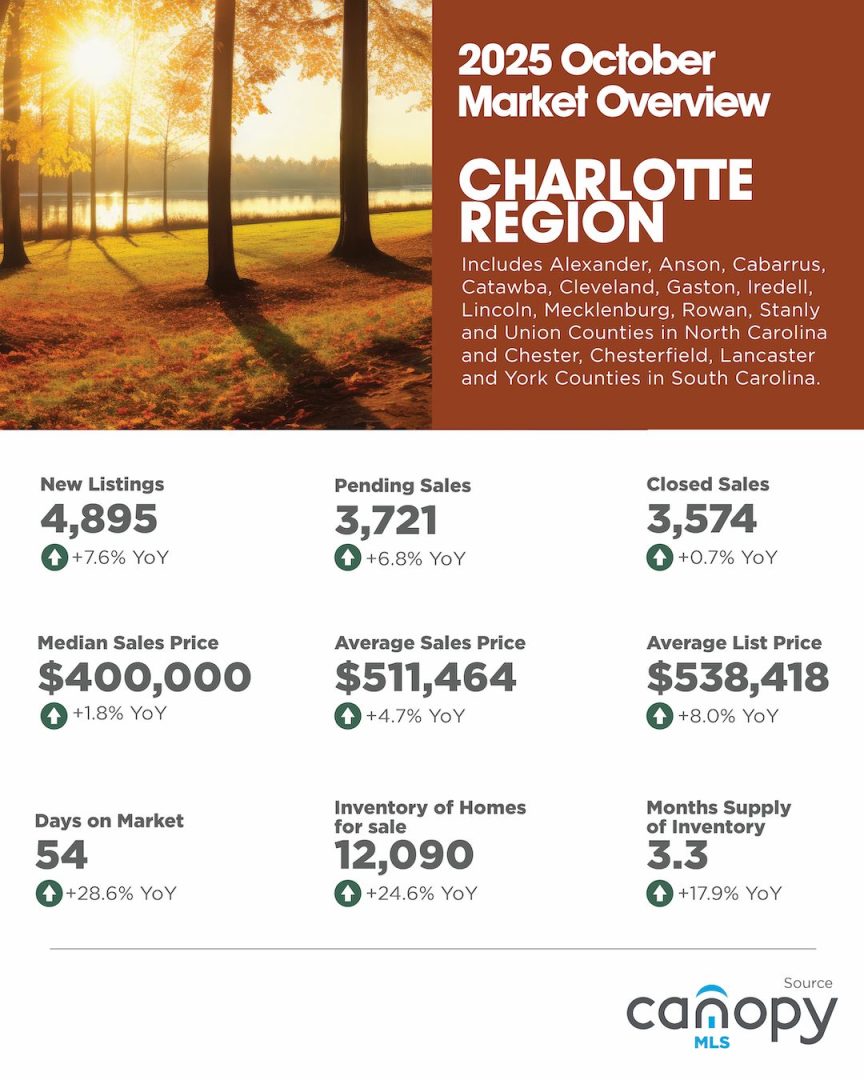
Based on information from Canopy MLS for the period October 1, 2025-October 31, 2025 in the 16 County Charlotte Region.
Want to know what this would mean for your family if you decide to buy or sell a Charlotte region home?
I can help.
Call me today at 704-779-0813 or contact me here.
There’s absolutely NO OBLIGATION. A consultation with Nina Hollander is FREE.
LOOKING FOR YOUR DREAM HOME IN GREATER CHARLOTTE?

FREE Home Buyer Guide: “Things To Consider When Buying A Home”


PREVIOUS 2025 CHARLOTTE HOUSING MARKET UPDATES
Charlotte Real Estate: September 2025
Charlotte Real Estate: August 2025
Charlotte Real Estate: July 2025
Charlotte Real Estate: June 2025
Charlotte Real Estate: May 2025
Charlotte Real Estate: April 2025
Charlotte Real Estate: March 2025
Charlotte Real Estate: February 2025
Charlotte Real Estate: January 2025