Ballantyne Real Estate November 2022
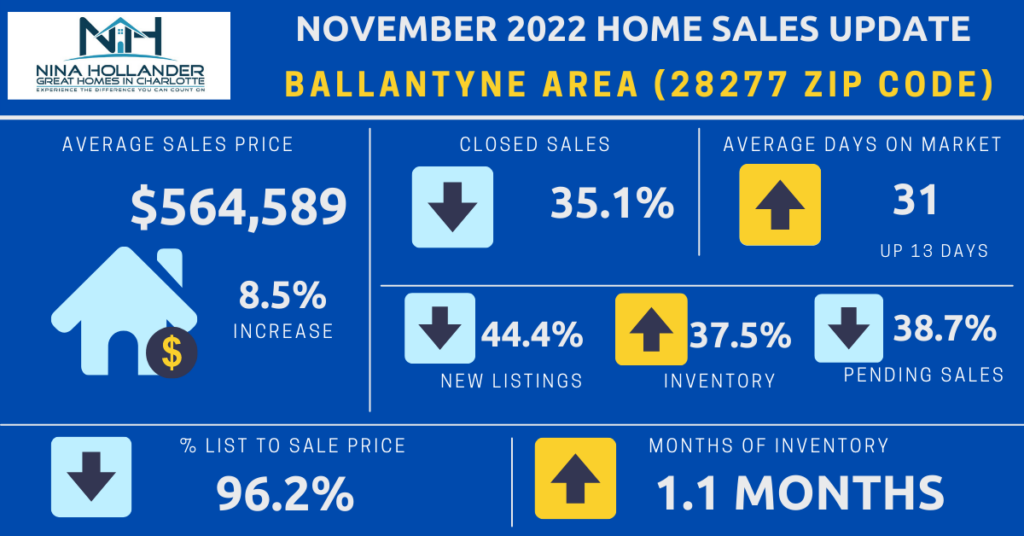
Ballantyne real estate November 2022 saw higher home prices and new listings down 44.4% year-over-year. Days on market increased to about one month. Sellers saw a lower median list price to final sale price at 96.2%. Closed and pending sales were down. The “feeding frenzy” of 2021 and first half of 2022 has come to an end in the Ballantyne area.
BALLANTYNE REAL ESTATE NOVEMBER 2022 HIGHLIGHTS

Latest news on Ballantyne real estate market November 2022 and what it means for you…
The Ballantyne housing market continued to cool in the month of November with lower closed and pending sales, higher days on market, lower list to sale price ratio, and more inventory. However, with just 1.1 months of inventory and new listing down month after month, Ballantyne area is no where near being a buyer’s market yet.
While inventory increased significantly and the months supply of homes increased to 1.1 months, Ballantyne homes sold in about a month, on average, and at higher prices year-over-year. Home sellers received a median 96.2% of list price in sale price.
Foot traffic was definitely down, with the average home seeing 9.5 showings in November 2022 compared with 19.5 showings in November 2021. Compared to October 2022, foot traffic was essentially flat at 9.5 showings in November versus 9.6 showings/per listing in October.
With closed and pending sales down, Ballantyne’s housing market is returning to more of a pre-pandemic rate of sales and the “feeding frenzy” we saw in 2021 and earlier in 2022 has abated.
BALLANTYNE REAL ESTATE SNAPSHOT
NOVEMBER 2022 vs NOVEMBER 2021
BALLANTYNE HOME SALE PRICES UP YEAR-OVER-YEAR | DOWN MONTH-OVER-MONTH
Average Ballantyne home sale prices increased 8.5% to $564,589 in November 2022 compared with the same month one year ago. Median home sale prices increased 11.6% to $516,000 year-over-year in November 2022. Month-over-month, Ballantyne’s average and median home sale prices decreased. It should be pointed out that not all of the decrease is a result of a market downturn. The price mix of homes sold in a given month in an area like Ballantyne plays a big role as well. Average home sale prices were about $120,000 higher in November 2022 than in November 2020. Homeowners continue to sit on significant equity.
Average Price Per Square Foot increased to $222/square foot in November 2022, up 6.2% over one year ago.
BALLANTYNE HOMES LIST TO SALE PRICE RATIO DECREASED IN NOVEMBER 2022
Home sellers received a median 96.2% of list price in final sale price in November, down 4% year-over-year and down 2.7% month-over-month. This is a clear indication that last year’s feeding frenzy is over with Ballantyne home buyers having a window of opportunity to negotiate on price.
BALLANTYNE HOMES CONTINUED TO SELL RELATIVELY QUICKLY DESPITE AN INCREASE IN DAYS ON MARKET
Ballantyne homes continued to sell in good time, generally in about one month. Median Days on Market were 25 days, 21 days higher year-over-year and three days higher month-over-month. Average Days on Market were 31 days year-over-year, up 13 days compared with November 2021. Average days on market were 2 days higher than in October 2022. The increase in days on market is another indication that the market has slowed.
BALLANTYNE SALES WERE DOWN IN NOVEMBER 2022
Closed sales decreased 35.1%, while pending sales decreased 38.7% in November 2022 compared with one year ago. With monthly mortgage payments increasing 55+% in the Charlotte area compared with one year ago, buyers are pulling back from the market.
Ballantyne foot traffic through listings was also down in November 2022. At 9.5 showings per home listing, this was the lowest level of foot traffic we’ve seen since April 2020.
BALLANTYNE MONTHS SUPPLY OF HOMES STILL LOW & NEW LISTINGS DOWN IN NOVEMBER 2022
Ballantyne’s months supply of homes at 1.1 months keeps it a seller’s market and we would need several more months of inventory to consider Ballantyne a balanced market, much less a buyer’s market. The months supply of homes increased from 0.6 months in November 2021 and was down by 0.2 months compared with October 2022. New listings, meantime, were down 44.4% compared with the same month one year ago.
Want to know what this would mean for your family if you decide to buy or sell a Ballantyne home?

I can help.
Call me today at 704-779-0813 or contact me here.
There’s absolutely NO OBLIGATION. A consultation with Nina Hollander is FREE.
BALLANTYNE REAL ESTATE MEDIAN PRICE TRENDS
13 HOTTEST SELLING BALLANTYNE AREA NEIGHBORHOODS

SEARCH BALLANYNE AREA HOMES

FREE Home Buyer Guide: “Things To Consider When Buying A Home”
WONDERING WHAT YOUR BALLANTYNE AREA HOME IS WORTH?

FREE Home Seller Guide: “Things To Consider When Selling Your House,”
THINKING OF SELLING YOUR HOME? CHECK OUT THE COLDWELL BANKER MARKETING ADVANTAGE
This Charlotte, North Carolina report on Ballantyne real estate November 2022 is provided by Nina Hollander with Coldwell Banker Realty, Ballantyne area specialist, neighbor, and Greater Charlotte residential real estate expert. I’ve been opening doors for Ballantyne home buyers and sellers since 1999.
If you’re considering selling or purchasing a home in the Charlotte metro area, I’d love an opportunity to earn your business, to exceed your expectations, and to show you why experience matters and how:
“The Right Broker Makes All The Difference.”
Search Ballantyne Homes For Sale
Thinking about buying or selling a home in the Charlotte area?
Nina Hollander is an expert local real estate agent serving Charlotte and surrounding communities. Whether you’re just starting your search or ready to make a move, Nina is here to provide trusted guidance every step of the way. Contact Nina today to get personalized help with your real estate goals.
Thinking about selling your Charlotte home? Request our free Charlotte home value report and to see what your home may be worth in today’s real estate market.
Check out the Real Estate Market in Charlotte NC
I work hard for my clients to ensure they have the best selling or buying experience possible. For comprehensive real estate information in the Greater Charlotte NC area, check out the links below!