Ballantyne Real Estate April 2025

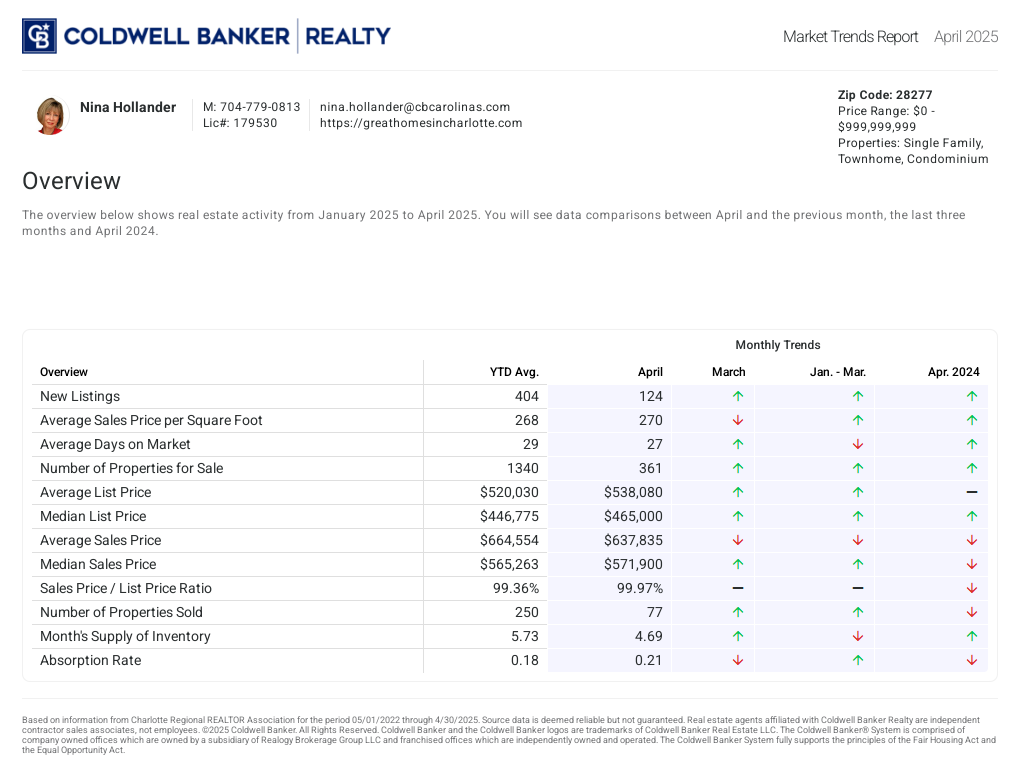
Ballantyne real estate April 2025 experienced a mix of trends. The median sale price increased to $571,900, up 3.98% from the previous month and was 10.64% lower than a year ago. This decline reflects the price mix of homes sold rather than a decrease in home values. The average sale price declined 8.53% month-over-month to $637,835 and declined 12.46% from April one year ago. Homes sold for an average of $270 per square foot, marking a 1.82% decline from March and a 1.89% gain year-over-year.
Homes continued to sell close to their list prices, with a list-to-sale price ratio of 99.97%, showing little room for negotiation. The average days on the market increased to 27 days from 21 days the month before and from seven days one year ago. Nonetheless, days on market of under 30 days are low by any measure. Sales increased a third consecutive month, with 77 homes sold—up from 72 in the prior month of March, but down from 93 sales in April one year ago.
Inventory grew a fourth consecutive month to 361 homes, an 8.73% increase month-over-month and nearly 39% higher than one year ago. Despite this rise, the months supply of inventory remained relatively flat at 4.69 months, indicating a balanced market between home buyers and sellers. New listings increased a fourth consecutive month to 124, up by 23 from the prior month and up by 32 from April 2024.
BALLANTYNE REAL ESTATE MARKET TRENDS April 2025
BALLANTYNE HOME SALE PRICES
Median sale price in April 2025 was $571,900, up 3.98% from $550,000 in March 2025. The median sale price was 10.64% lower than in April one year ago. It’s noteworthy that the median price reflects the middle point of all the homes for sale at any given time, which is affected by the mix of homes on the market. A decrease in median price is not the same as a decrease in home values.
Average sale price in April 2025 was $637,835, down 8.53% from March 2025. The average sale price was 12.46% lower than $728,581 in April 2024. With home sale prices in the Ballantyne area ranging from the mid-$300,000s to over $2 million, the decline in average sale price is more likely a result of the price mix of homes sold rather than an actual decrease in property values.
Average Sale Price Per Square Foot was $270 in April 2025, down 1.82% from $275 in the previous month and was 1.89% higher than the $265 price per square foot for Ballantyne homes in April 2024.
BALLANTYNE HOMES LIST TO SALE PRICE RATIO JUST UNDER 100%
The list to sale price ratio of 99.97% in April 2025 was essentially unchanged from one month (99.61%). Ballantyne home buyers did not see many opportunities to negotiate on price in April 2025. Compared with April 2024, the list to sale price ratio declined from 101.94%.
BALLANTYNE AVERAGE DAYS ON MARKET UNDER ONE MONTH IN APRIL 2025
Average days on market for Ballantyne area homes in April 2025 were 27 days, up from 21 days one month ago, but still low by any measure. Average days on market were 20 days higher than in April 2024 and 13 days higher than in April 2023.
BALLANTYNE SALES UP A 3RD CONSECUTIVE MONTH
The number of properties sold in April 2025 increased to 77, up 6.94% from 72 properties sold in the previous month of March. Compared with April 2024 and April 2023, the number of properties sold was approximately 17% lower in the current year. April 2024 sales stood at 93. April 2023 sales stood at 78.
BALLANTYNE INVENTORY UP A 4TH CONSECUTIVE MONTH
Ballantyne’s inventory of properties for sale in April 2025 was 361, up 8.73% from 332 properties one month ago. Inventory was 38.85% higher than the 260 properties for sale in April 2024. The number of properties for sale were higher by 98 compared with April 2023.
The months supply of inventory increased slightly from 4.48 months in March to 4.69 months in April, keeping the Ballantyne area in a balanced market between home sellers and home buyers in the current year.
NEW LISTINGS UP A 4TH CONSECUTIVE MONTH
The number of new listings in Ballantyne area in April 2025 was 125, up 22.77% from 101 in the previous month of March. New listings were 34.78% higher than in April 2024, which had 92 new listings. Compared with April 2023, new listings were up by 30 properties in April 2025.
Want to know what this would mean for your family if you decide to buy or sell a Ballantyne home?

I can help.
Call me today at 704-779-0813 or contact me here.
There’s absolutely NO OBLIGATION. A consultation with Nina Hollander is FREE.

WONDERING WHAT YOUR BALLANTYNE AREA HOME IS WORTH?

FREE Home Seller Guide: “Things To Consider When Selling Your House,”
This Charlotte, North Carolina monthly Ballantyne real estate report is provided by Nina Hollander with Coldwell Banker Realty, Ballantyne area specialist, neighbor and Greater Charlotte residential real estate expert. I’ve been opening doors for Ballantyne home buyers and sellers since 1999.
If you’re considering selling or purchasing a home in the Charlotte metro area, I’d love an opportunity to earn your business, to exceed your expectations, and to show you why experience matters and how:
PREVIOUS BALLANTYNE AREA REAL ESTATE REPORTS
Ballantyne Real Estate March 2025
Ballantyne Real Estate February 2025
Ballantyne Real Estate January 2025
Search Ballantyne Homes For Sale
Thinking about buying or selling a home in the Charlotte area?
Nina Hollander is an expert local real estate agent serving Charlotte and surrounding communities. Whether you’re just starting your search or ready to make a move, Nina is here to provide trusted guidance every step of the way. Contact Nina today to get personalized help with your real estate goals.
Thinking about selling your Charlotte home? Request our free Charlotte home value report and to see what your home may be worth in today’s real estate market.
Check out the Real Estate Market in Charlotte NC
I work hard for my clients to ensure they have the best selling or buying experience possible. For comprehensive real estate information in the Greater Charlotte NC area, check out the links below!